Cells Sizes
Distributions of cell sizes were measured 3 times a day for each limitation and growth rate using a Coulter counter. On the reproducibility plots below (figure 1) each measurement is
plotted in red and the mean of all measurements for a condition in black. At the highest growth rates (0.14), the cell count per unit volume was small, and thus the distributions are more noisy.
The distribution of cell sizes for each condition (limitation and growth rate) was modeled as a mixture of two
generalized Gaussian distributions
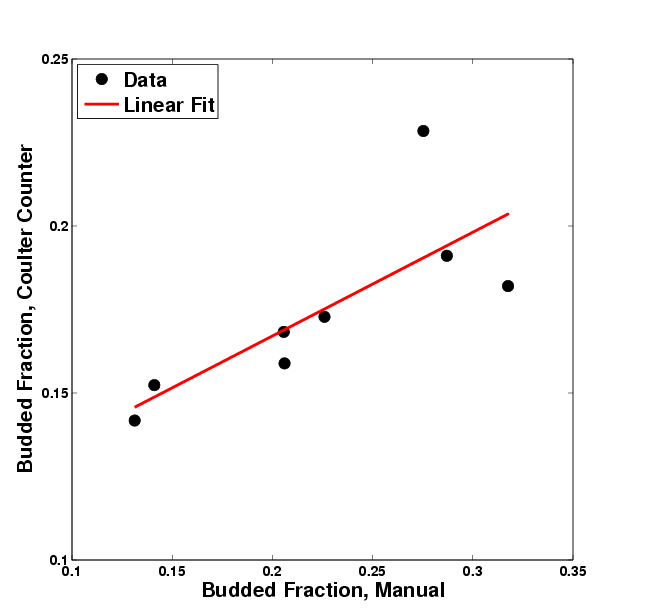
with the idea that the distribution with smaller mean corresponds to unbudded cells and the distribution with larger mean corresponds to budded cells.
The decomposed distributions are plotted below (figure 2 and 4) together with the fraction of budded cells inferred from the distributions
of cell sizes.
|