 |
1.1 Distribution of Pearson Correlations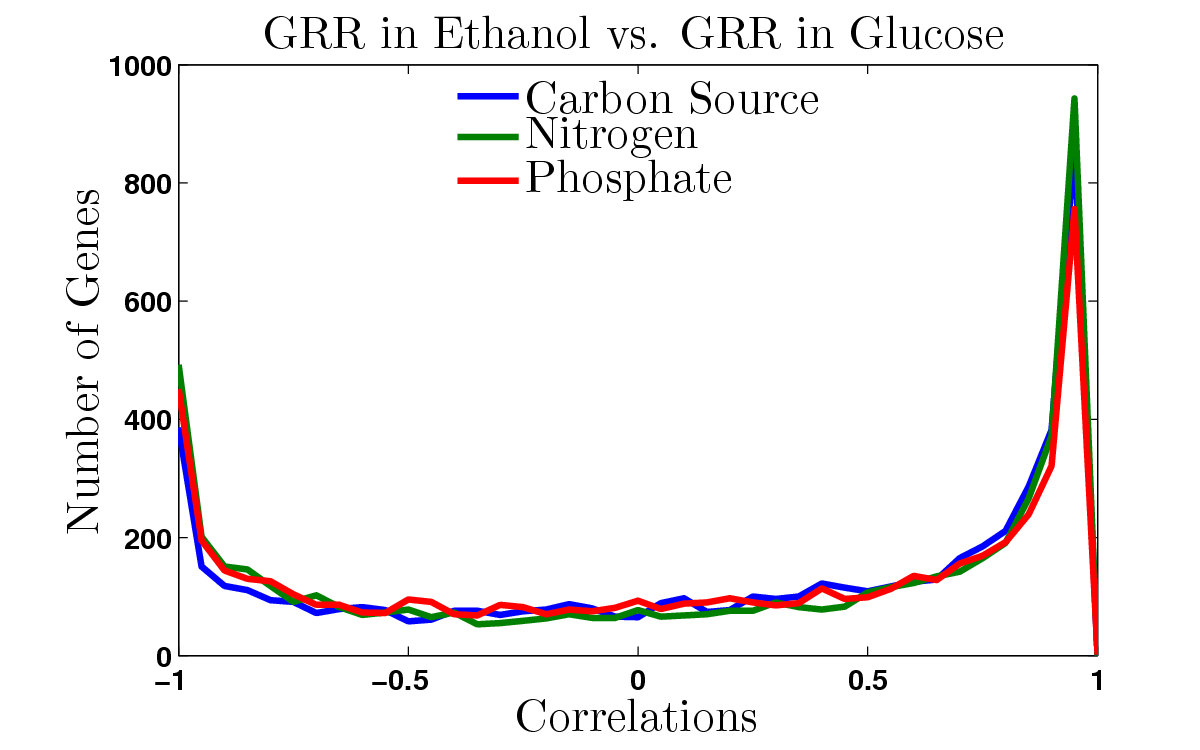
|
|
1.2 Rank Order Distribution of Pearson Correlations |
|
2 Functional ClustergramThe color code represents the mean slope (exponent) and mean fold change for each set of functionally related genes as defined by SGD.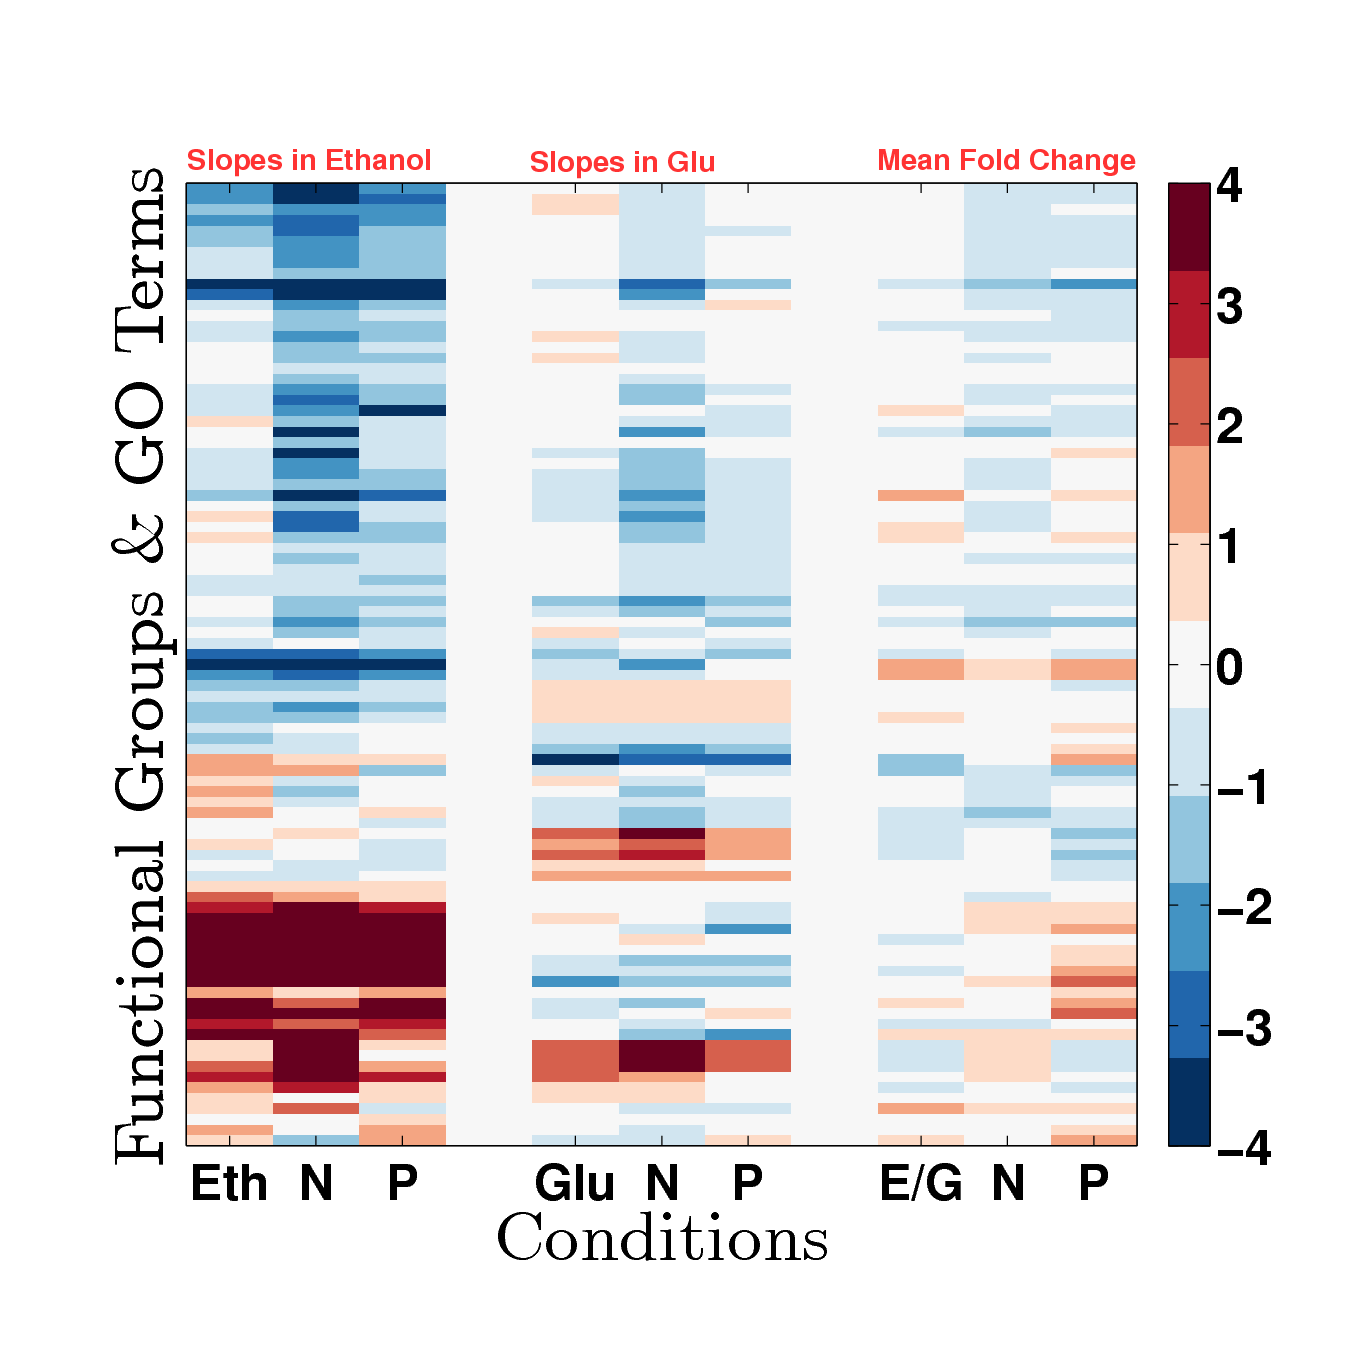
|
|
3 Full Functional ClustergramThe color code represents the mean slope (exponent) and mean fold change for each set of functionally related genes as defined by SGD.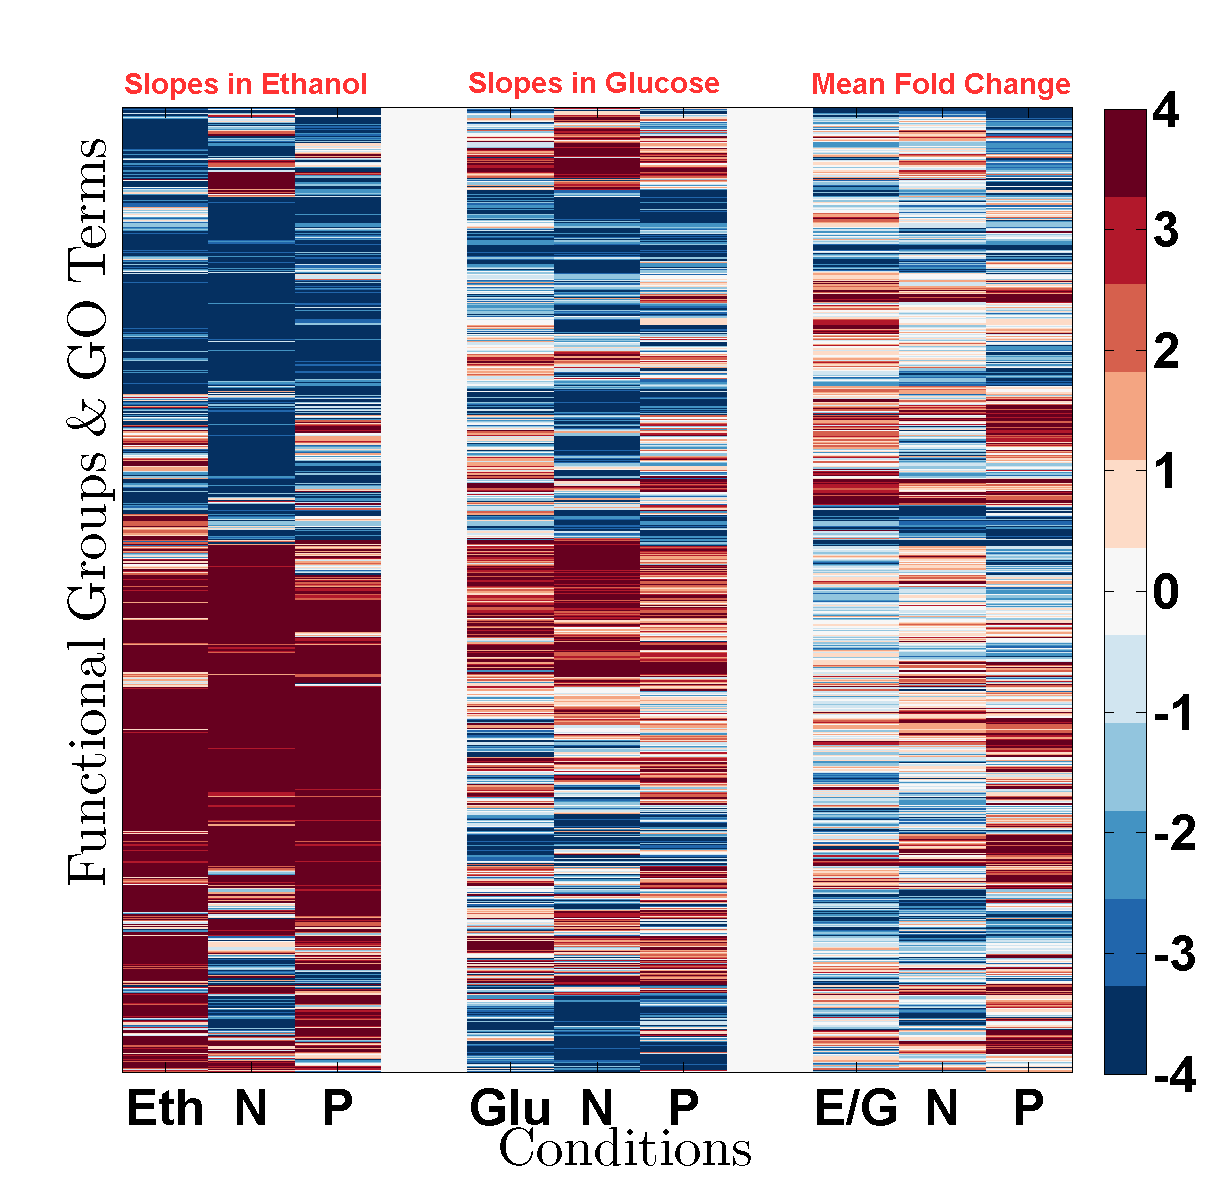
|