 |
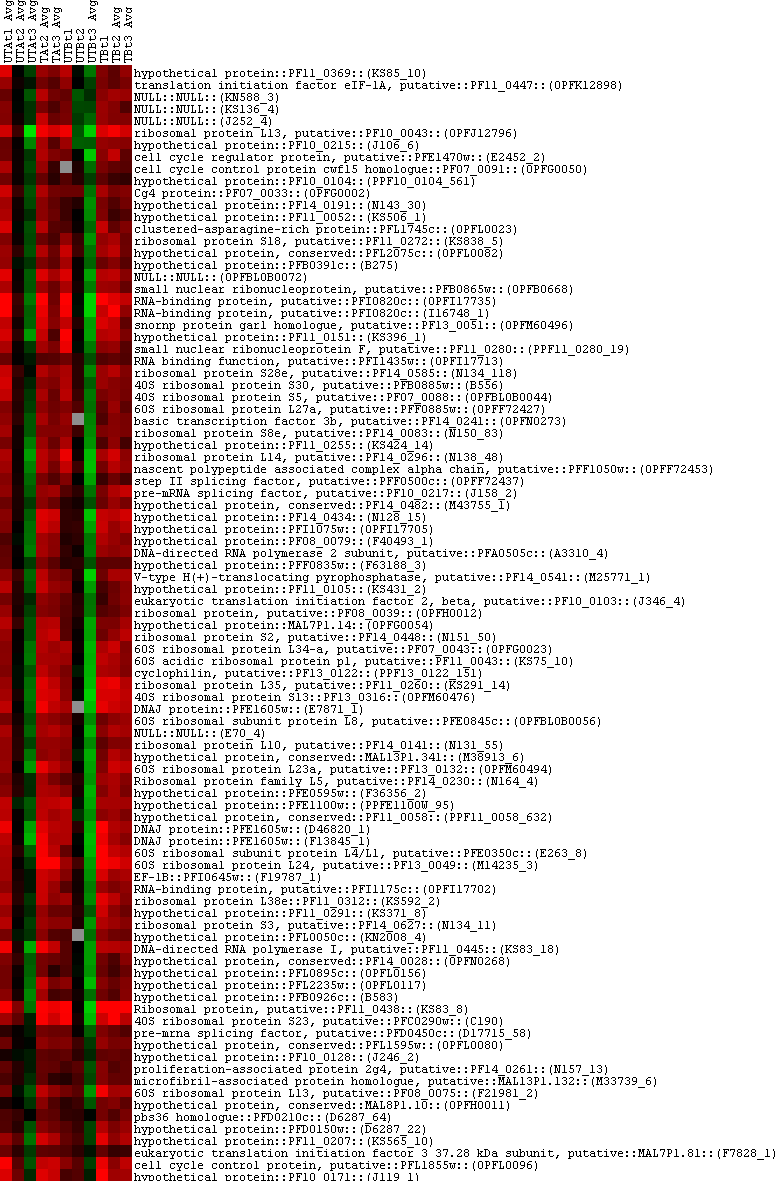
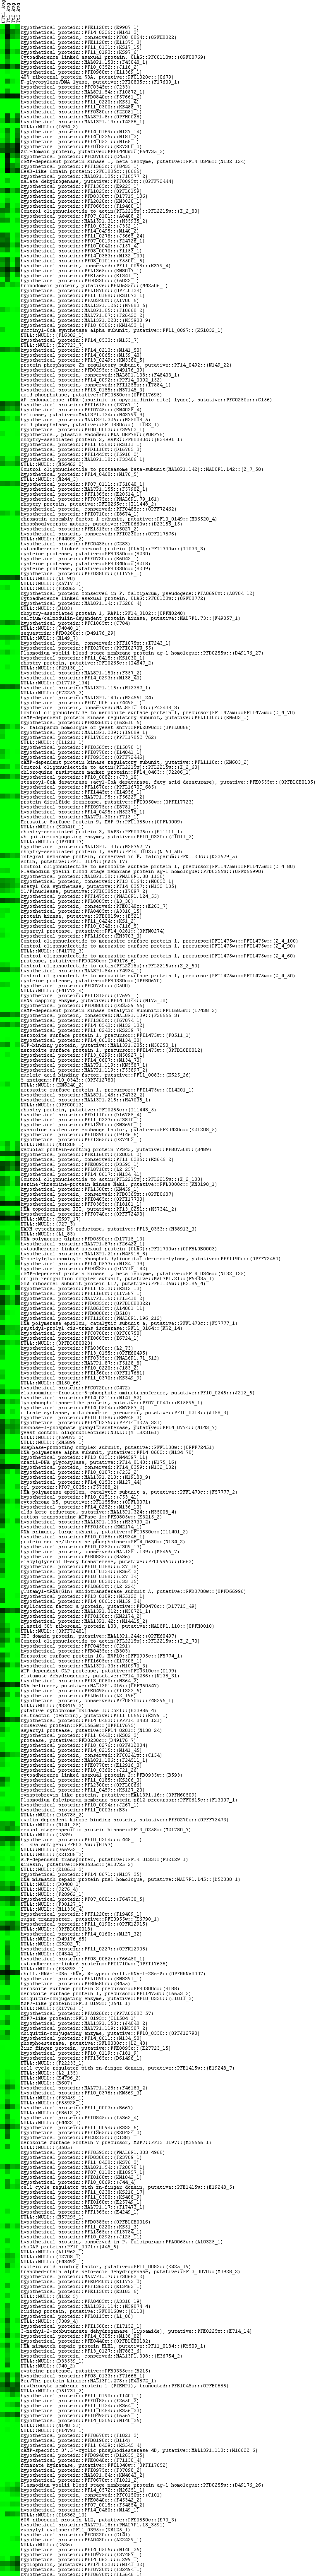
Co-inhibition of Plasmodium falciparum S-adenosylmethionine decarboxylase/ornithine decarboxylase reveals perturbation-specific compensatory mechanisms by transcriptome, proteome and metabolome analyses |
| Home |
|---|
|
|
| Explore |
|
primary data clusters |
| Supplement |
|
supplementary material |
| Download |
|
figures and tables from manuscript |
| Authors |
|
and contributors |
| Explore |
|---|
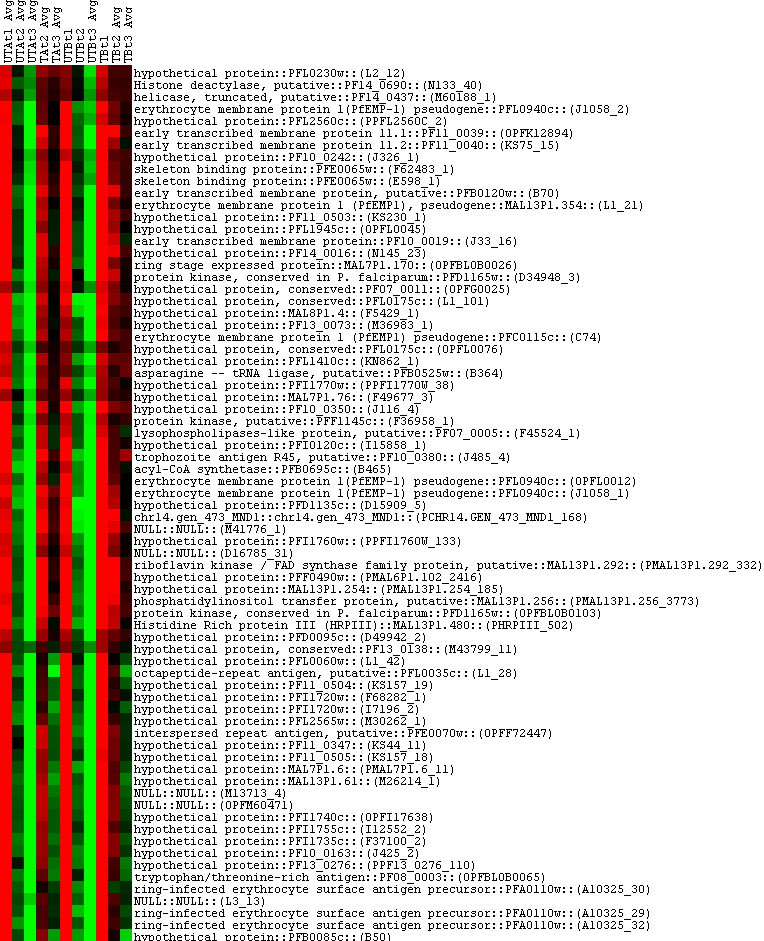
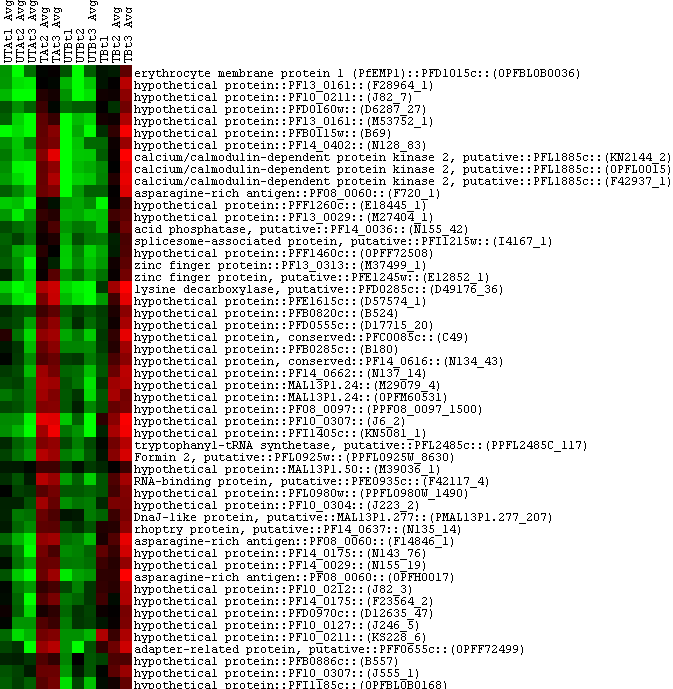
Below are exploratory clusters produced by unsupervised hierarchical data clustering. Cluster tightness is indicated with correlation values in parentheses and all files are in .png format. Clusters of all data Clusters against UTt1 (relative t0) |