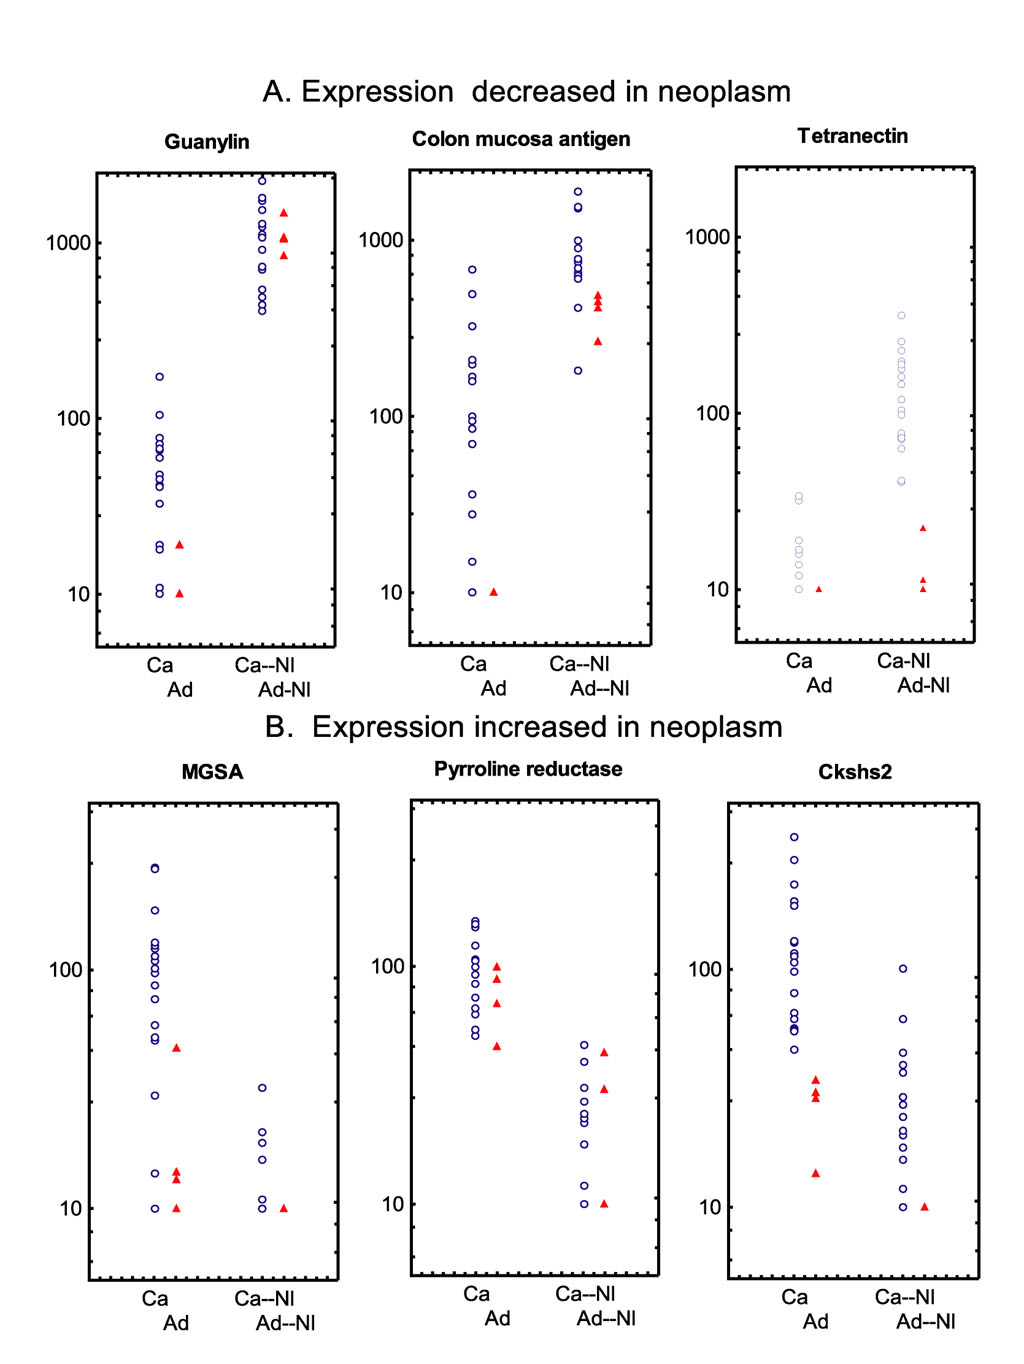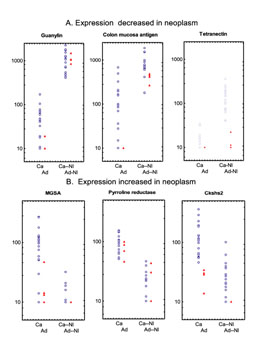
Figure 2
Comparison of transcript expression levels in
individual neoplasms (adenoma and adenocarcinoma) with paired normal tissue samples. Figure 1(a): transcripts with decreased expression
in tumors. Figure 1(b): transcripts with
increased expression in tumors. For each
transcript, the mean ratio of expression in neoplasm to normal tissue and normal was
4-fold or greater (p<0.001). The ordinate
scale is logarithmic. Due to the adjustment of transcripts with an intensity <
10 to 10, data points may superimposed, and visualized as a single data point. However,
for each transcript the number of samples was the same. Ca, Carcinoma (N = 18); Ad,
Adenoma (N = 4); Ca-Nl, normal paired with carcinoma (N = 18); Ad-Nl, normal paired with
adenoma (N = 4).
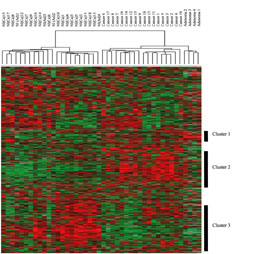
Figure 3a
Cluster
map and phylogenetic tree resulting from a two-way pair-wise average-linkage cluster
analysis. Approximately 1800 genes in common to two versions of GeneChip
(Affymetrix) were combined into a single matrix that was then clustered as described in
the text. Each color patch in the resulting visual map represents the expression
level of the associated gene in that tissue sample, with a continuum of expression levels
from dark green (lowest) to bright red (highest). Missing values are coded as
silver. The carcinomas and their benign precursors, the adenomas, are placed on an
entirely different trunk than are the paired normal tissues. Strikingly, the adenomas and
the carcinomas are also separated from one another, occupying adjacent branches of the
same trunk. The color map indicates that this hierarchy is associated with several
distinct groupings of increased gene expression intensity (Clusters 1 – 3).
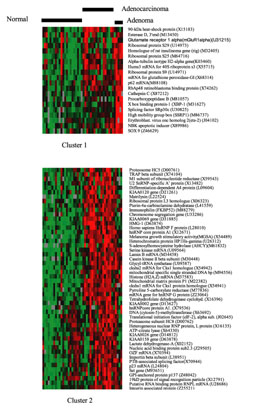
Figure 3b
Upper
panel, Cluster 1:
A cluster of genes that are more intensely expressed in adenoma than in normal tissue or
carcinoma. This grouping contained
approximately 8-10 genes whose mRNA expression appeared to be much higher in the adenoma
samples than in associated normal tissue or the carcinomas.
Lower panel, Cluster 2:
A cluster of genes that are more highly
expressed in carcinoma than in adenoma or normal tissue.
This is a broad and diffuse cluster, which contains many products that were also
identified simply by examining expression ratios (Table 1).