Array Design
| Home |
|---|
|
Array Design Homepage |
| Figures |
|
Figures from the manuscript |
| Supplement |
|
supplementary figures and tables |
| Download |
|
raw and derived data used in the publication |
| Authors |
|
researchers and collaborators |
| Links |
|
to relevant sites |
| Supplement | |
|---|---|
|
A copy of the supplementary information can be obtained here |
|
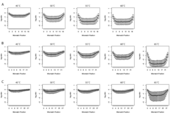 |
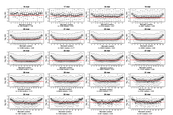
Supplement Figure 1 : The position of a mismatch in a DNA probe affects that extent to which hybridization is reduced. The greatest effect is observed when a mismatch occurs in a central position of the probe. This effect holds for 20mers (a), 25mers (b) and 30mers (c) all hybridization temperatures. At lower temperatures this effect is not symmetrical, which is likely due to interference from the solid surface of the microarray. |
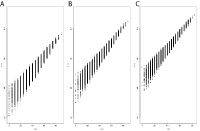 |
Supplement Figure 2 : For a fixed probe length the DNA melting temperatures, as computed using the unified nearest neighbors parameters, vary across a large range. The Tm is correlated with %GC but shows significant deviation due to the nearest neighbor effects as shown for (A) 20mer, (B) 25mer and (C) 30mer probes. |
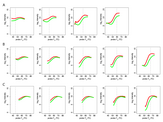 |
Supplement Figure 3 : The effect of hybridization temperature on total duplex formation for perfectly matched (red line) and mismatched (green line) duplexes. We applied a smoothing spline probe intensity to data from each hybridization experiment. The relationship between probe Tm and total intensity at each probe is affected by the hybridization temperature (indicated in gray) for (A) 20mers, (B) 25mers and (C) 30mers. In general, total hybridization increases for perfectly matched and mismatched DNA with increased probe Tm. The greatest difference in hybridization efficiency is observed for probes with Tm equal to and less than the hybridization temperature. However, when the probe Tm is well below the hybridization temperature the difference in hybridization is less pronounced. |
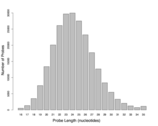 |
Supplement Figure 4 : The distribution of probe lengths on the isothermal microarray designed with a target Tm of 55°C. |
 |
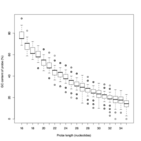
Supplement Figure 5 : The relationship between the position of a mismatch in probe and sequence discrimination for different probe lengths on an isothermal array when homozygous DNA is hybridized to the array. For each boxplot the probe length is indicated on the top axis. The number of probes (n) is indicated below each plot as is the median ratio for the mismatch positions within the interquartile range of each probe, which is also indicated on each plot by a red horizontal line. |
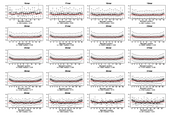 |
Supplement Figure 6 : Relationship between SNP position in probe and sequence discrimination for different probe lengths on the isothermal array when heterozygous diploid DNA is hybridized to the array. For each boxplot the probe length is indicated on the top axis. The number of probes (n) is indicated below each plot as is the median ratio for the mismatch positions within the interquartile range of each probe, which is also indicated on each plot by a red horizontal line. |
 |
Supplement Figure 7 : Relationship between probe length and %GC for isothermal probe microarray design. |
 |
Supplement Figure 8 : Relationship between probe length and variance of log2 ratios of self-self hybridized DNA on isothermal microarrays. |
 |
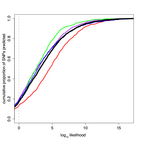
Supplement Figure 9 : Prediction of homozygous SNPs is reproducible across independent hybridizations. The cumulative distribution of prediction scores for held out training/test results are shown for four different hybridizations (red, green, blue and purple lines). The combined distribution of the four tests is shown in black. |
 |
Supplement Figure 10 : Prediction of heterozygous SNPs is reproducible across independent hybridizations. The cumulative distribution of prediction scores for held out training/test results are shown for four different hybridizations. The combined distribution of the four tests is shown in black. |