|
Figures
|
 |
Figure 1 : Sequence discrimination depends on probe length and hybridization temperature. Increasing the temperature at which hybridization reactions are performed increasingly inhibits formation of mismatched duplexes reducing the observed ratio of mismatched to match duplex formation on the microarrays. A) When hybridization is performed at a given temperature probes of length 20 nucleotides (plus signs) exhibit enhanced sensitivity to mismatches over probes of 25 nucleotides (circles) and 30 nucleotides (triangles). Increasing the hybridization temperature improves sensitivity to sequence variants for all probe lengths. B) Hybridization of DNA from a diploid yeast that is heterozygous at all 24,549 SNP sites shows a similar trend with respect to both probe length (20mers (plus signs), 25mer (circles) and 30mers (triangles)) and hybridization conditions. With increasing hybridization stringency the median ratio tended towards the theoretical optimum of log2 ratio = -1. |
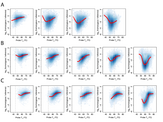 |
Figure 2 : The relationship between the position of a mismatch in probe and sequence discrimination for different probe lengths on an isothermal array when homozygous DNA is hybridized to the array. For each boxplot the probe length is indicated on the top axis. The number of probes (n) is indicated below each plot as is the median ratio for the mismatch positions within the interquartile range of each probe, which is also indicated on each plot by a red horizontal line. |
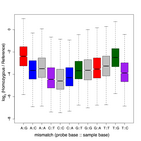 |
Figure 3 : Differential effect of mismatches on annealing efficiency at isothermal probes. The median ratio for the interquartile region of probes of all lengths is plotted for each possible mismatch. The first nucleotide is the base present in the probe. The second nucleotide is the base present in the genomics DNA sample. Homo-mismatches are in gray. Symmetrical hetero-mismatches are shown in the same color. |
 |
Figure 4 : Figure 4. SNPScanner performance using ratiometric data from an isothermal microarray. Using an average of 7 probes per SNP site the SNPScanner algorithm accurately predicts 93% of homozygous SNPs with a log10 likelihood value greater than 0 (red line). Decreasing the average number of probes interrogating each SNP to an average of 4.8 (green line), 3.4 (blue line) or 2.0 (orange line) reduces the overall magnitude of the likelihood values for SNP predictions, but does not appreciably increase the false negative rate. The position of the SNP in the probes affects the false negative rate (see inset): for SNP positions in the outer thirtieth percentile (green dashed line; 2.1 probes/SNP) 836/1000 SNPs are predicted. We only detect 792/1000 SNPs when the SNPs only occur in the outer 20th percentile of probes (black dashed line; 1.5 probes/SNP). Constraining SNP positions to the outer 50th (blue dashed line; 3.5 probes/SNP) or 70th percentile (orange dashed line; 5.0 probes/SNP) did not increases the false negative rate. |
 |
Figure 5 : The SNPScanner algorithm is able to correctly predict the presence of 87% heterozygous SNPs with a 7.2% false positive rate. The number of false positives rapidly decreases with increasing log10 likelihood values. |